A/B Testing - The exciting experiment
This is the story of how I led experimentation program and helped elevate engagement rate, executing 6 tests within the first 6 months with an 83% success rate.
Team
Digital Experience / Product / CRO
Role
Senior Product Designer
Tools
Figma / Optimizely / Hotjar / Atlassian / GA4
Background
Mazda Australia, as a leading consumer car brand, was actively looking to grow its digital marketing capability. Conversion Rate Optimisation (CRO) became a key business strategy to drive measurable impact across digital channels.
The challenge
With only four months remaining on our contract with a digital marketing agency, the business made a strategic decision to bring CRO in-house. However, the internal team lacked the skills, tools, and processes required to run experimentation independently.
How might we build and enable a capable experimentation team within four months while maintaining business momentum?
Taking ownership
I stepped forward to lead this transition. Recognising the skills gap, I actively upskilled myself through webinars from the Microsoft Experimentation Team and resources from Optimizely. I then took the initiative to transition the CRO program in-house and build our experimentation capability from the ground up.
Team structure & operating model
I partnered with the Head of Digital and Senior Manager of Digital Experience to explore different team models, outlining the pros and cons of each. We agreed to start with a centralised experimentation model, which was well-suited to a mid-sized organisation and helped us build early momentum.
In this model, the experimentation team operated as a shared service, running experiments on behalf of multiple business units while establishing consistent standards and practices.
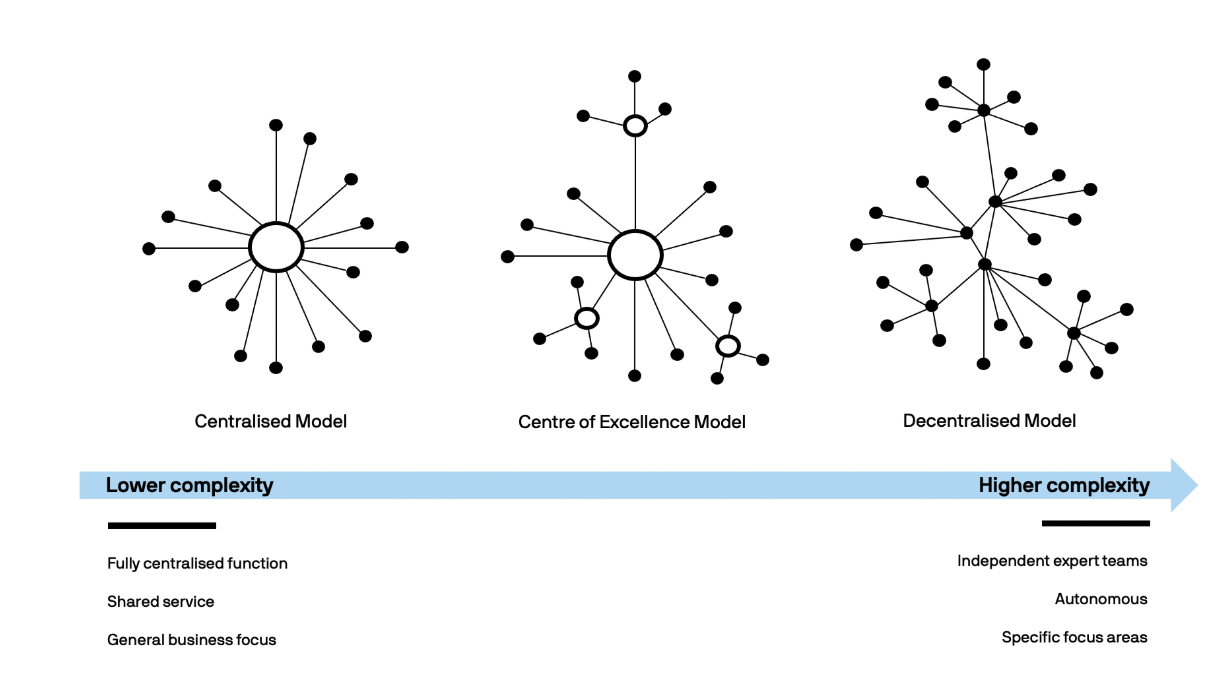
3 common models of experiment team
Roles, process & governance
To enable the team, I defined:
clear roles and responsibilities
a standard test submission process
a RACI map and process flows tailored to our operating context
I also introduced tooling and frameworks to support scientific experimentation, ensuring every test included:
a clear hypothesis
test type
success metrics
sample size considerations
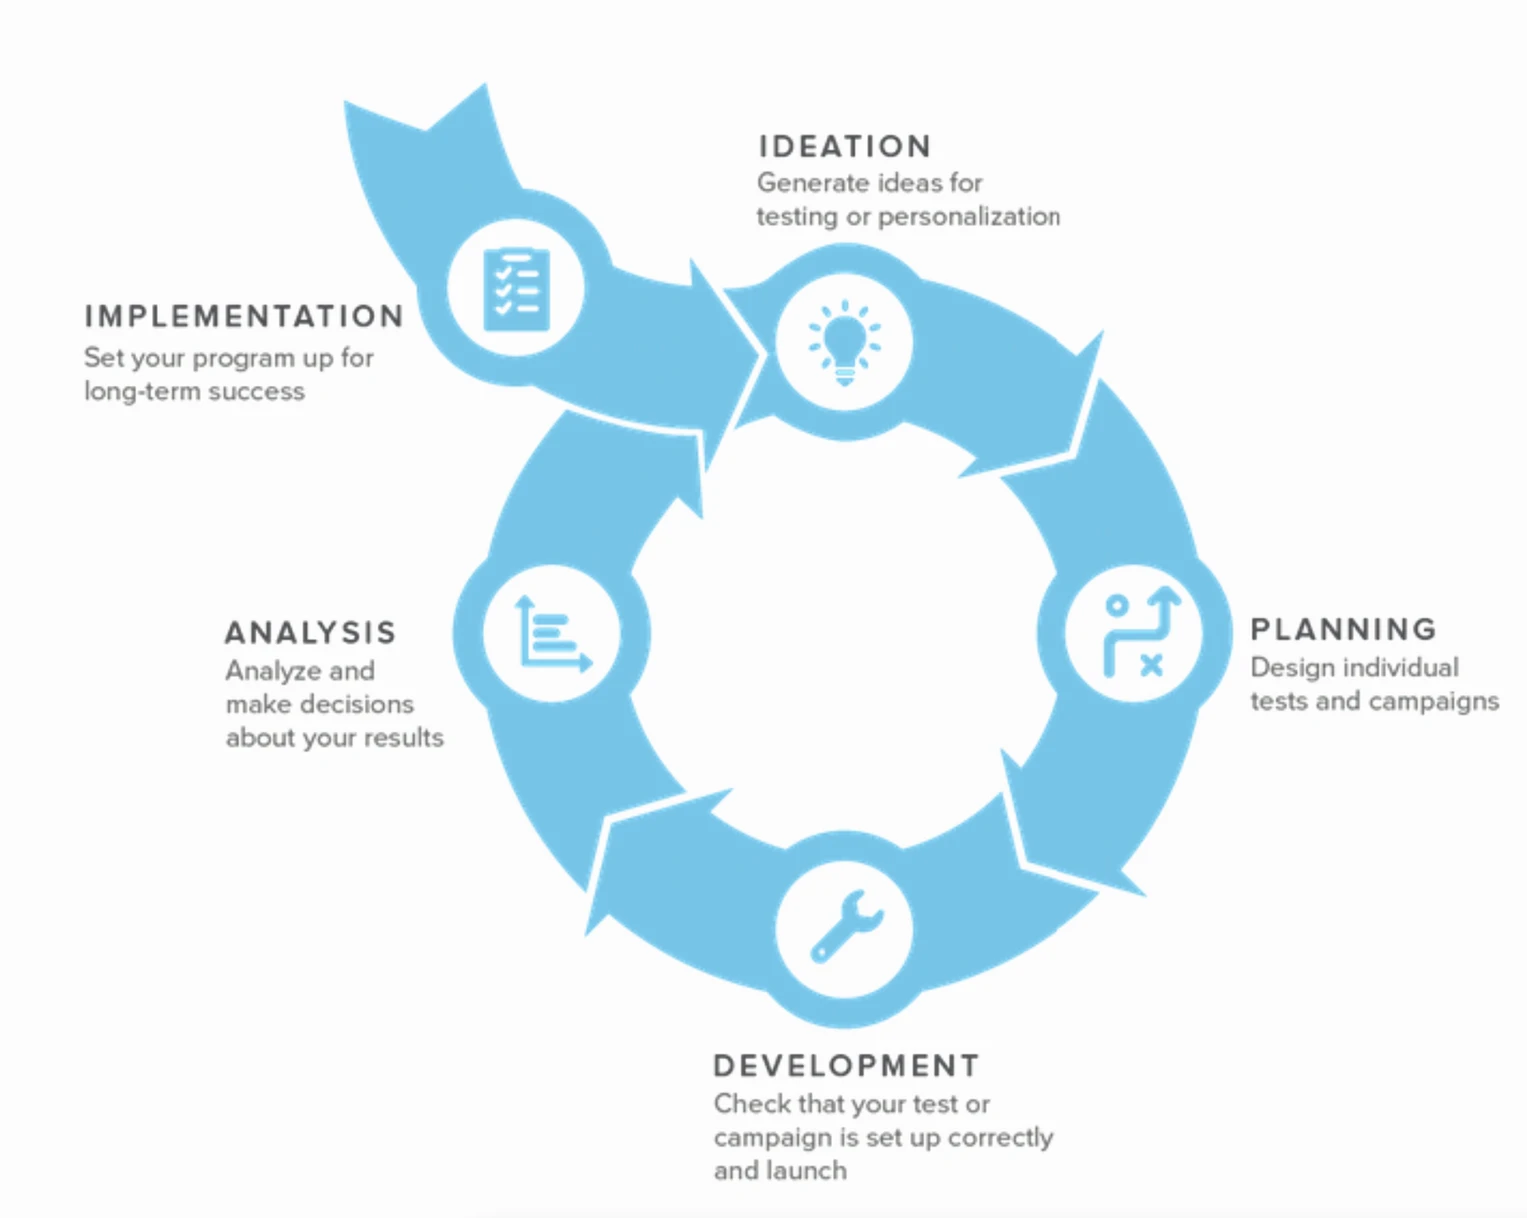
Experimentation process
Prioritisation & focus
To manage demand and maximise impact, we adopted the ICE (Impact, Confidence, Ease) framework for prioritisation. This helped the team focus on experiments most likely to deliver value with the least complexity.
Given our constraints, a team of five with only 20% capacity allocated to experimentation, I deliberately prioritised high-impact, low-complexity tests to set the program up for early success.

We use ICE framework to prioritise
Key constraints & risks
Limited resourcing
Part-time team allocation
Need for quick wins to build trust and momentum
By acknowledging these constraints early, we designed a program that was realistic, focused, and scalable.
Outcome & Impact
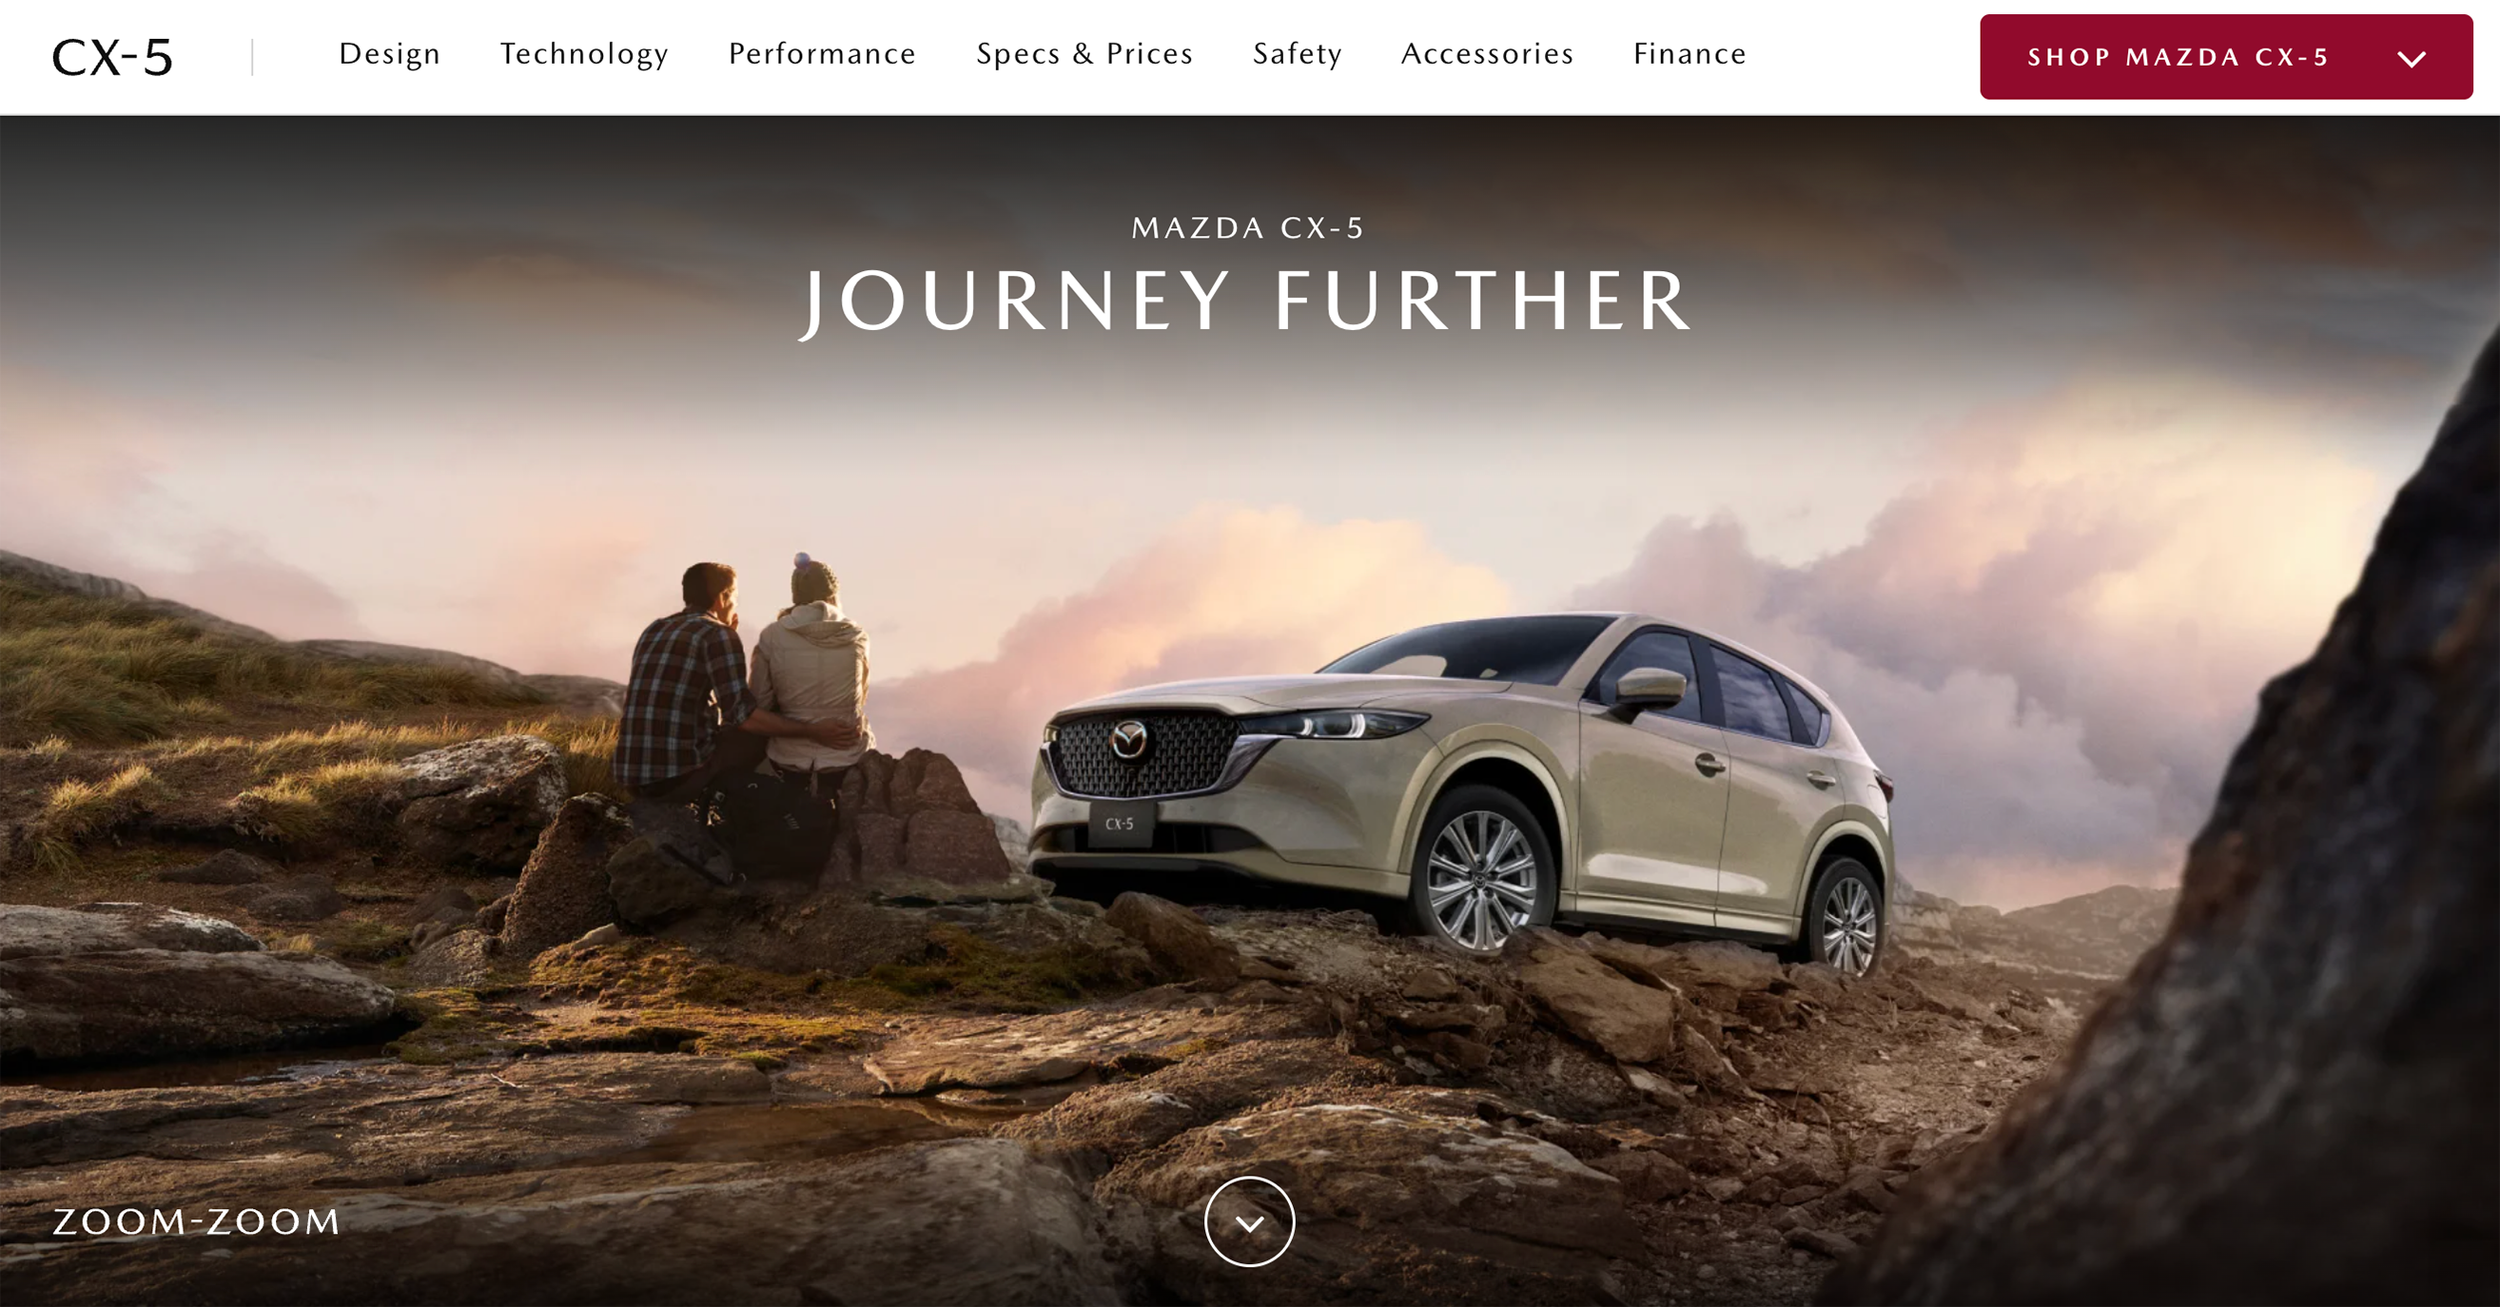
#1 A/B Testing: CX-5 landing page content restructure
The first test we did was CX-5 vehicle landing page restructure. Vehicle landing pages were facing loading issues because of large amount of media-rich content it contained.
We streamlined the information architecture by reducing the subheadings from 9 to 7 and reorganizing them in a more meaningful way, having 'Design' as the first section and move 'Specs and Prices' lower down. This approach was developed based on user research. Over the years, consumer buying habits have evolved, with a greater emphasis on aesthetics and emotional impact rather than just the mechanical aspects of the product.

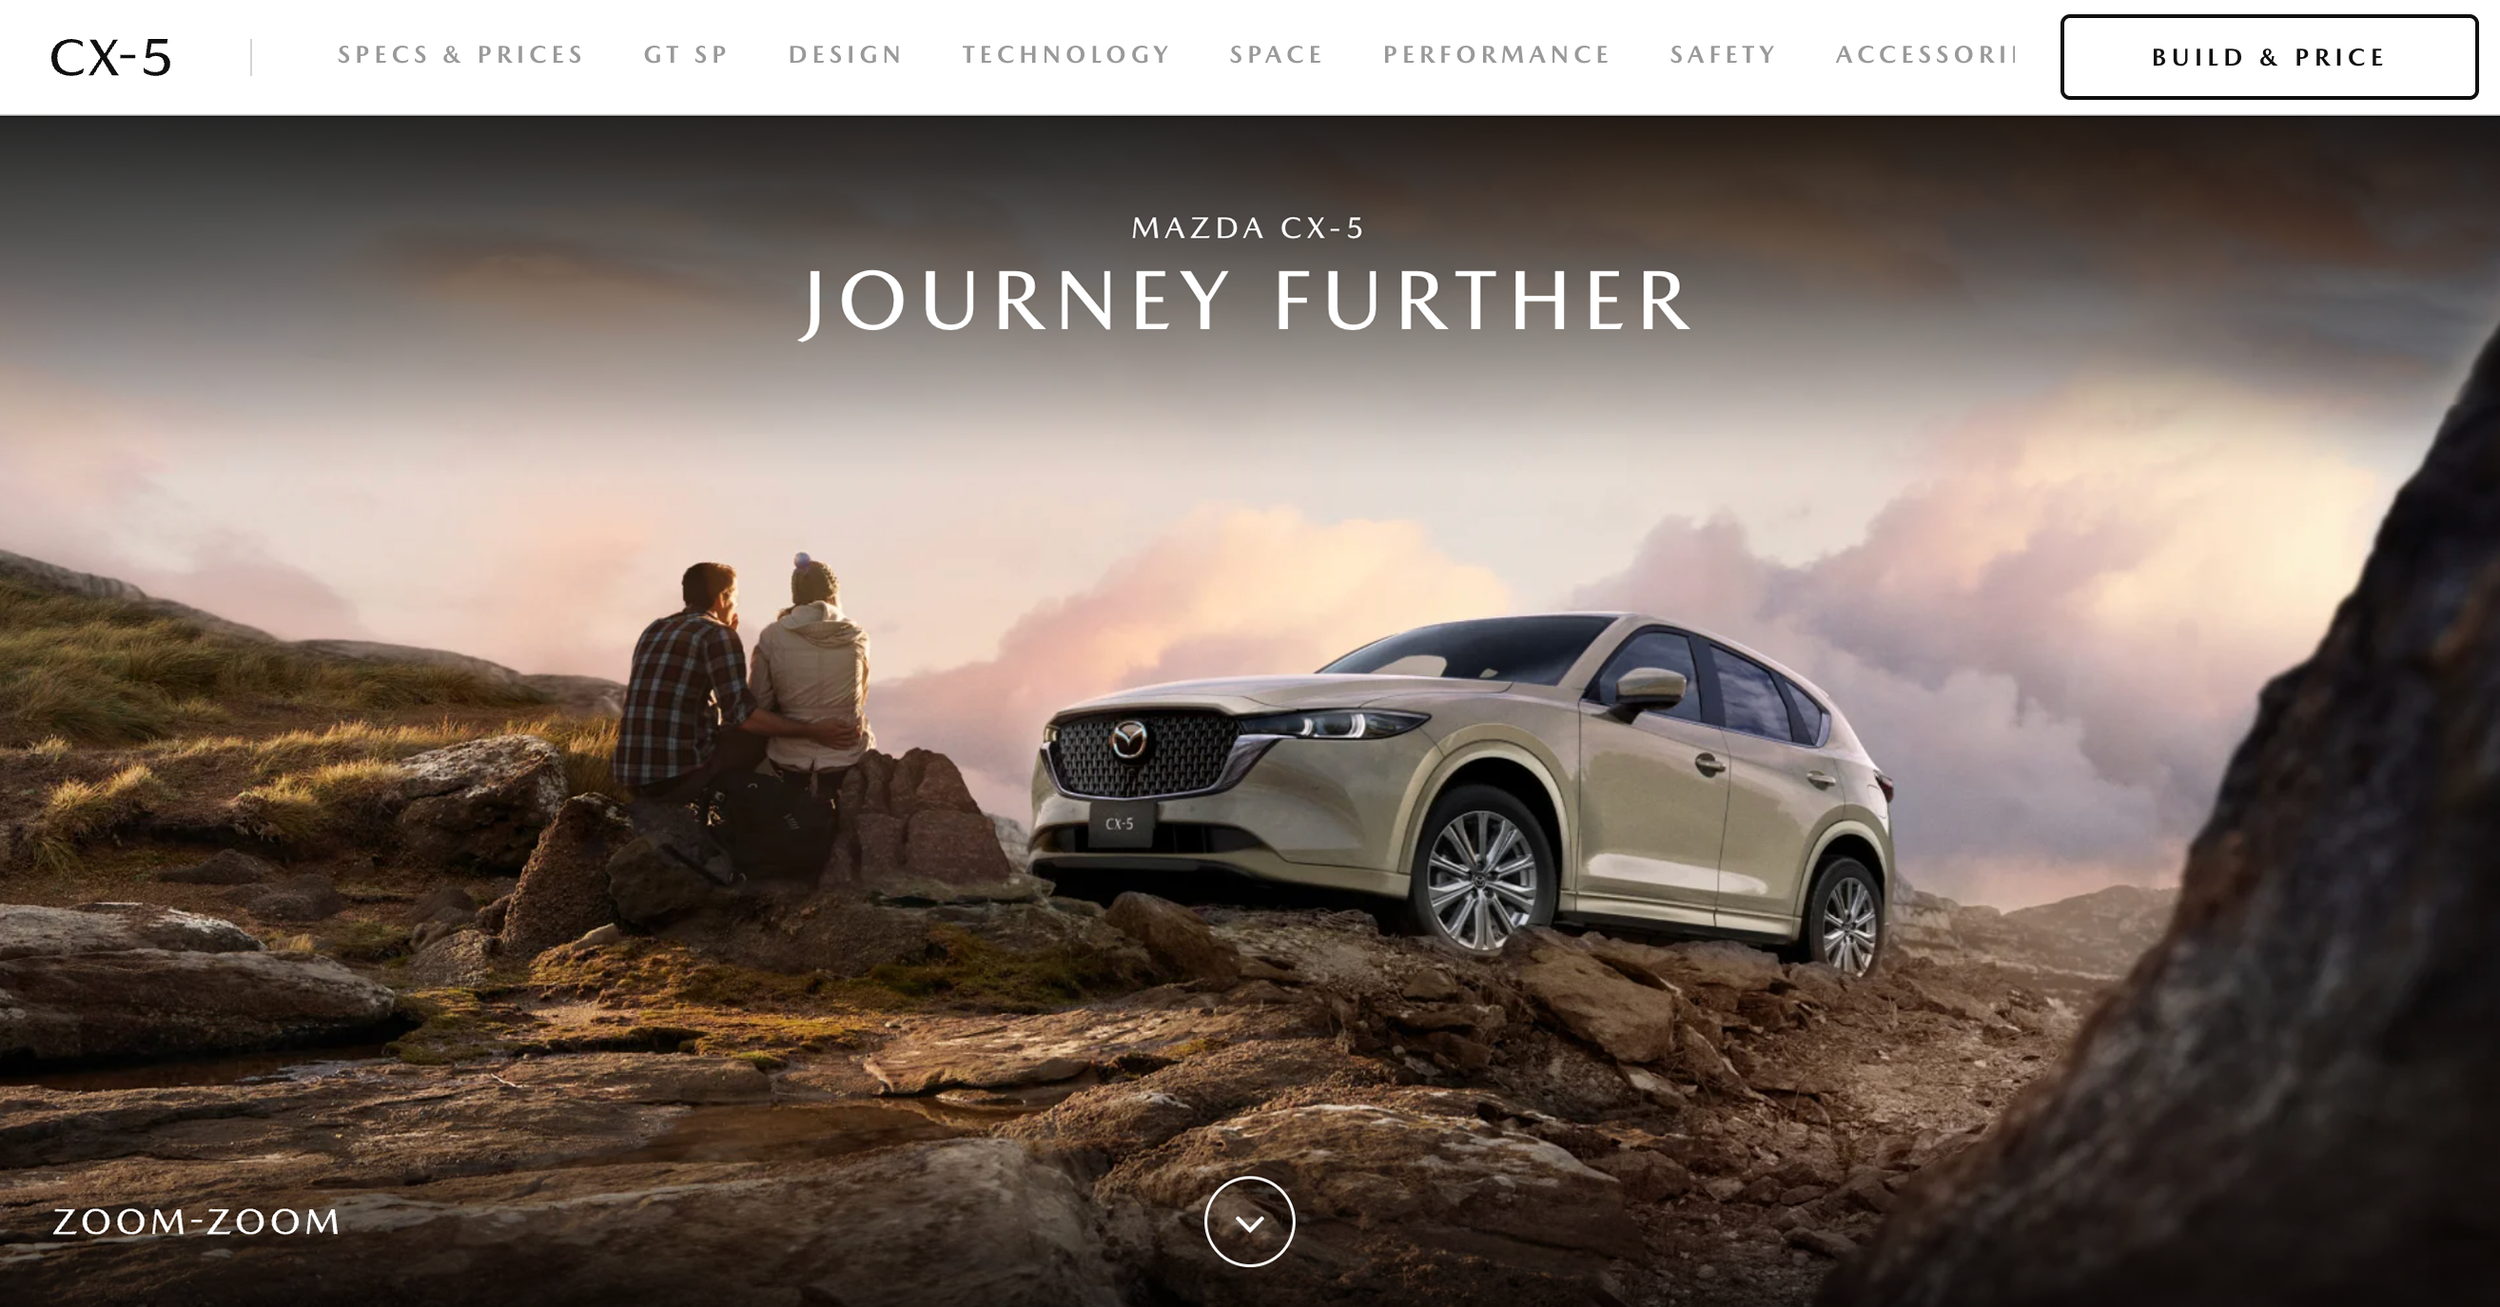
Control with 8 sections showing in the sticky nav(left) vs Variant with restructured 7 sections showing in the sticky nav(right)
Results after 3 weeks shows overall uplifts in engagement:
Scroll depth in mobile increased from 21% to 75%
Time on page increased from 43 secs to 1.9min

Scroll depth in mobile achieved significance, increasing from 21% to 75%.
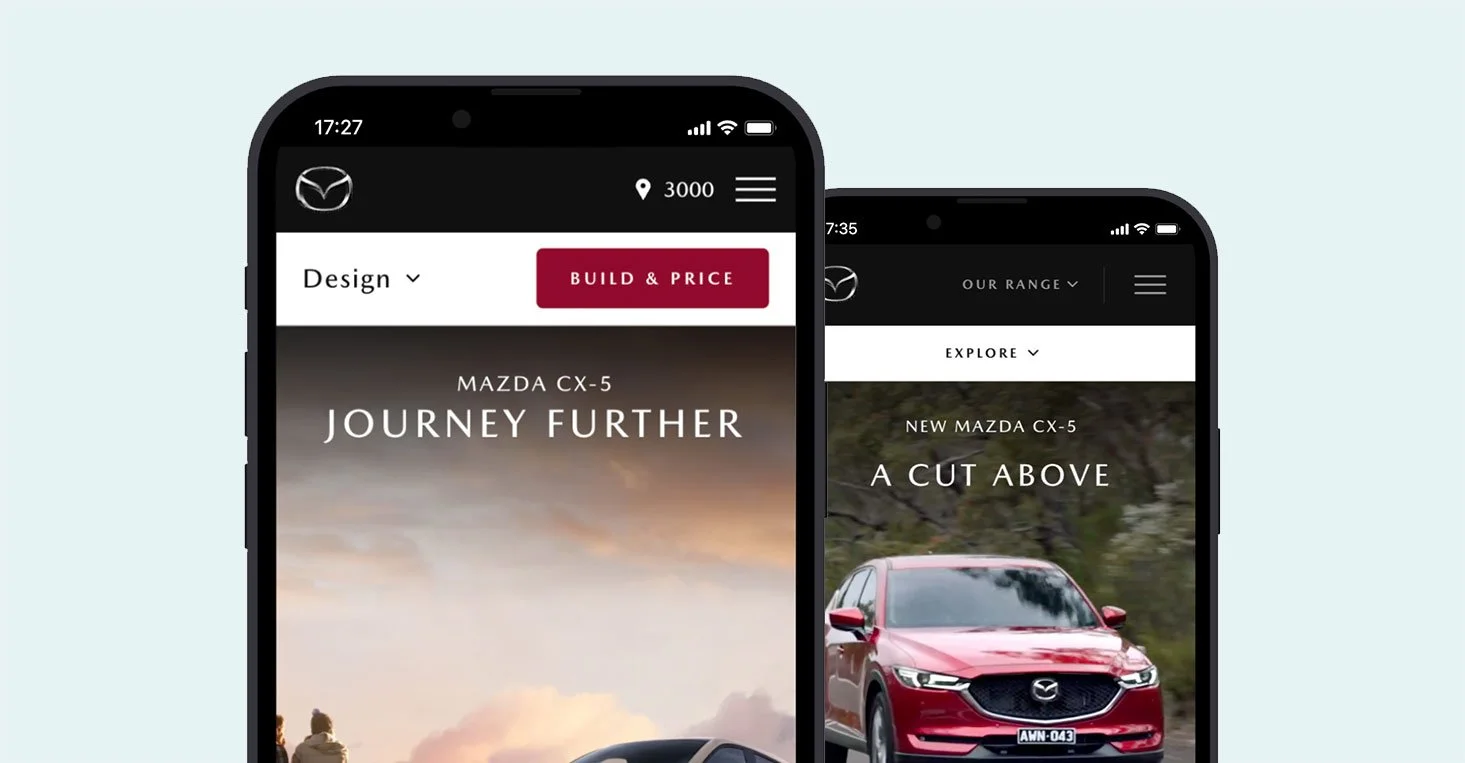
#2 A/B Testing: Surface out CX-5 VLP Primary CTAs
Highlighting CTAs for both desktop and mobile users proved to be a significant experiment. Replacing an outlined style CTA with a prominent red group button was transformative.
This approach not only captured attention but also offered more potential next steps. Depending on their stage in the buying journey, customers are presented with options to compare, finance, or find a dealer.

Control with outlined primary CTA(left) vs Variant with red grouped button providing more CTAs options to take the next steps(right)
Results after 3 weeks:
Build and Price click through rates achieved significance, increased by 41%
Find a Dealer click through rates achieved significance, increased by 12%
Compare click through rates achieved significance, increased by 11%
Finance click through rates achieved significance, increased by 6%